It's no April Fool's joke that we're continuing to become better readers and writers in 4B! In our
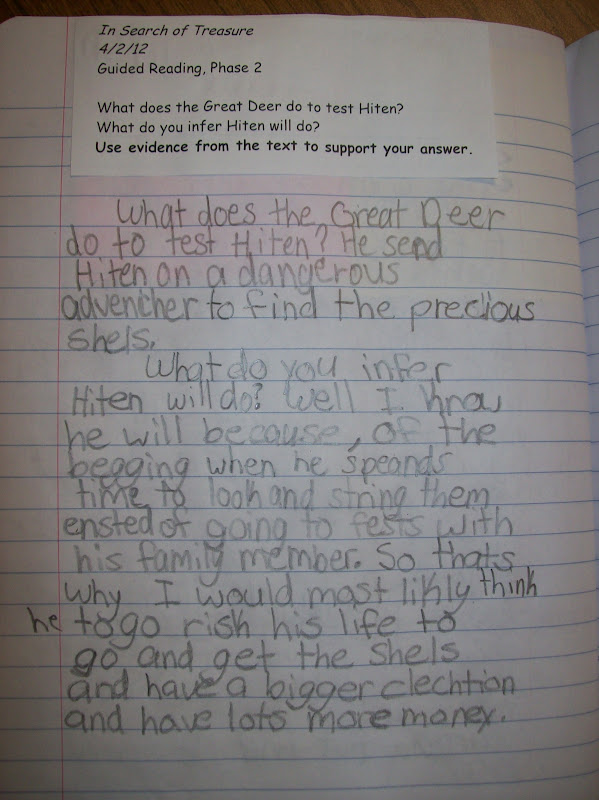
last blog posting about our animal research (Parts 11 & 12), students were peer conferencing using the 5-4-3-2-1 peer conferencing sheet to make their writing better. Here are a few examples of their revised drafts! Peer pairs worked to add descriptive adjectives, lively verbs, similes, and sound effects to make their non-fiction writing a little more powerful.
All of last week, we started the publishing process. Some of you will remember I had the kids draft each section out of order. (Students drafted their introductions and conclusions
after they drafted the body of their reports, that way, the kids actually had knowledge about their animals so they could write an effective introduction and conclusion). The first step to our publishing process was to staple each students' drafts together so they followed this order: introduction, paragraph on habitat, paragraph on diet, paragraph on defense mechanisms, conclusion, resource page. Next, I modeled for students how to organize the first page of their published copy so that it looked professional. I had them center their title, name, and date, in addition to gluing a picture of their animal they had printed off. (Please note, we took a day to go to the computer lab so students could find a picture of their animal and cite its source. If you're following our process for these animal reports, you may want to do the same!) I also modeled for students where the first word of their report should begin. (You'd think indenting would be a real simple skill for kids to remember. Unfortunately, it's a toughie for most fourth graders!)

Students used the rest of Writer's Workshop to publish the first two paragraphs (introduction and habitat paragraph) of their animal reports.
We took a total of three days to publish our reports. On day one, I set a goal for my students to get their introduction and habitat paragraphs published. On day two, they had their diet and defense mechanism paragraphs due by the end of Writer's Workshop. On the last day of publishing, students were to finish their conclusion and resource page. Students who did not meet their 'publishing goal' on any particular day were to finish their goal as homework. That way, we all started in the same place on each 'publishing day', and it assured their reports would be done by the end of the quarter.

Here are some of the first reports to be finished! I am so proud of all the hard work the kids put in doing their research: the planning, the researching of information, the rearrangement of their information, the drafting, the peer conferencing, the publishing; students definitely learned that research isn't something that gets completed in one day. It is a thought-provoking process that takes patience and determination. I can't wait to show these off by hanging them in the hallway. I will also be copying students' finished reports and putting them into an Animal Research class book we will store in our classroom so students can learn from one another!
Overall, this writing project took 4-5 weeks. If you are interested in following our process, you may want to browse through each blog posting below and/or consider getting the
student sheets featured in Parts 1, 2, 3, & 4 which can be found at my TpT store!
Our Process for Writing a Non-Fiction Animal Report
(Click on the purple underlined link for a more thorough explanation of each part!)
Part 1: Picking a topic (animal)/subtopics (habitat, diet, defense) & using the table of contents/index in non-fiction book to infer/record page numbers where we think our information will be (2-3 days)
Part 2: Citing our non-fiction book & taking notes on note strips (2 days)
Part 3: Citing an encyclopedia & taking notes on note strips (1-2 days)
Part 4: Citing a website & taking notes on note strips (1-2 days)
Part 5: Cutting our habitat note strips and rearranging them for best order (1 day)
Part 6: Cutting our diet note strips and rearranging them for best order (1 day)
Part 7: Cutting our defense mechanism strips and rearranging them for best order (1 day)
Part 8: Drafting our habitat paragraph from our organized habitat notes (1-2 days)
Part 9: Drafting our diet paragraph from our organized diet notes & drafting our defense mechanism paragraph from our organized defense mechanism notes (2 days)
Part 10: Drafting the introduction (1 day)
Parts 11 & 12:
Part 11: Drafting the conclusion (1 day)
Part 12: Peer conferencing (2 days)
******
In other news, late last week we continued practicing our
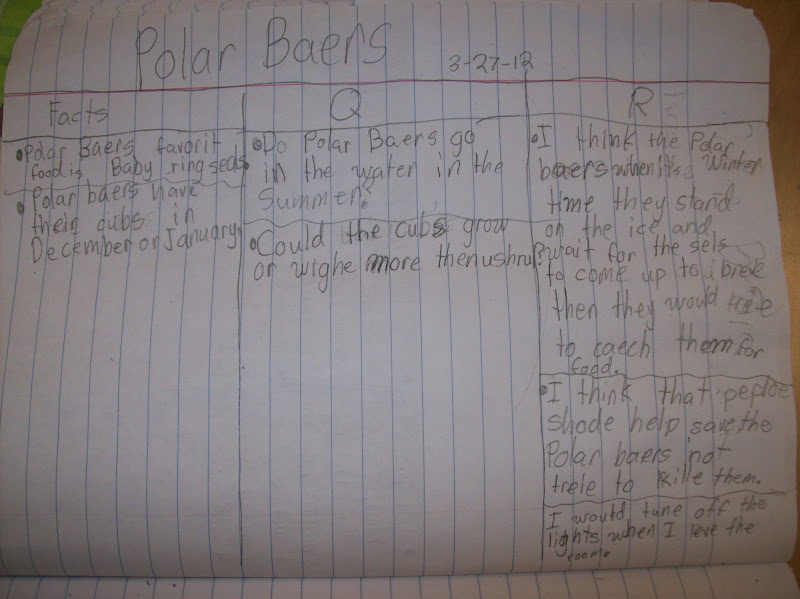
Facts-Questions-Response reading strategy (introduced on Monday of last week) for helping us remember information we read. Using high-interest topics is key to helping students practice this strategy, so I used a book about September 11th titled
America is Under Attack by Don Brown as a mentor text for this strategy. As students listened, they recorded in their Thoughtful Logs the facts they heard, the questions that popped into their minds, and their inner voice responses. By merging what we read with our questions and inner voice responses, we can remember so much more of what we read because we connect with the topic on a deeper level!
I also used the FQR strategy in guided reading to support learners in our room who I thought could use a little more support with it. We used the second page of the polar bear article from the original FQR mini-lesson as our practice text. (That way, students had some schema of the topic and familiarity with the text.)
In Social Studies, we are in the middle of our unit on People of the U.S.A. Last week, my lesson objective was to demonstrate that the United States is made up of people of all different nationalities. We all make up the 'American people', but our ancestors come from many different countries all over the world!

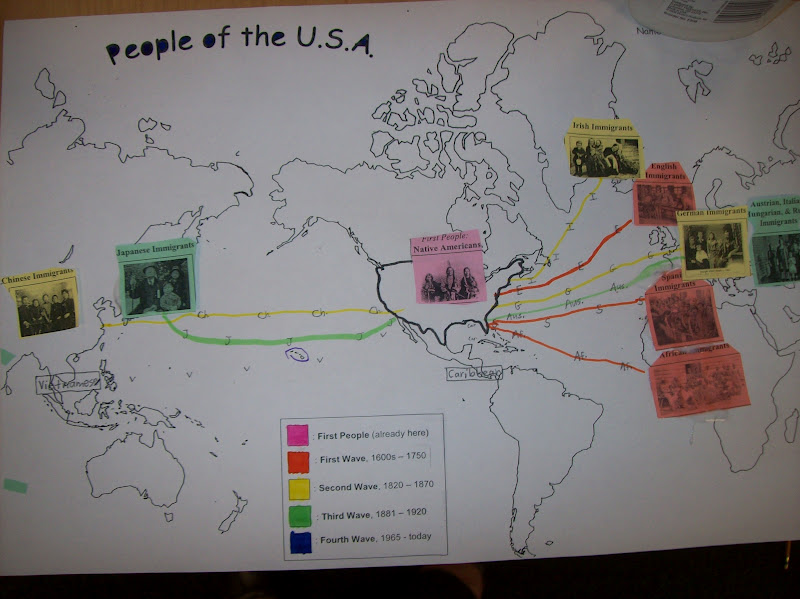
I decided to make this lesson a little more hands-on for my students to increase their engagement so they could physically touch the countries where many of our ancestors have come from and trace the routes our ancestors traveled to get to the United States. Most kids have schema that immigrants sailed across the Atlantic to Ellis Island, but most fourth graders don't have a clue that immigrants also sailed across the Pacific to Angel Island in San Francisco! To help teach this lesson, I rearranged a standard map, putting the U.S. in the middle and arranging the rest of the world accordingly. By making this adjustment, my students would be able to see the routes most European immigrants and African slaves took across the Atlantic Ocean and the route many Asian immigrants took across the Pacific Ocean. Each student got his/her own map to do this activity. (You'll also notice I have boxes with nationalities inside them already on the map and little letters going across each of the oceans to assist me in teaching this lesson.)

I also used color-coding in this lesson to help reinforce the 'order of people' in/coming to the U.S. The first people in the U.S. were the Native Americans. I had students color the first box on their map key pink or red (the first color of the rainbow) to stand for the first people who were already here (Native Americans) and handed out a picture of Native Americans that I had copied on pink paper. Students glued the picture to the box labeled 'Native Americans' that I had lightly drawn on the continent of North America.
I had students color the next box on their map key orange to stand for the first wave of immigrants who came over between 1600-1750. I handed out pictures of English immigrants, Spanish immigrants, and African slaves that I had copied on orange paper. Students glued each of these pictures to the labeled boxes on the map, and then used an orange marker to trace the routes these immigrants took. All three of these groups traveled across the Atlantic. At this time, I explained that many Spanish immigrants and African slaves arrived at the southeastern border of the U.S. As one student inferred, "So, Miss Bongers, that's probably why slavery was so popular in the South ... because that's where most African slaves were when they got here..." I love it when those kinds of connections happen for our kids. The best part is that he made the discovery all on his own!
I had students color the next box on their map key
yellow (to stand for the second wave of immigrants who came over between 1820-1870). I then handed out pictures of Irish immigrants, German immigrants, and Chinese immigrants that I had copied on
yellow paper. Students glued each of these pictures to the appropriate places on their maps, and then used a
yellow marker to trace their routes. Students could now begin to see that Chinese immigrants came across the
Pacific Ocean, not the Atlantic. This was the perfect opportunity to discuss Angel Island in San Francisco (which, in a later lesson, will lead to a discussion on the Transcontinental Railroad!)
I had students color the next box on their map key
green to stand for the third wave of immigrants who came over between 1881-1920. I handed out pictures of Austrian, Hungarian, & Russian immigrants and Japanese immigrants on
green paper. Students glued each of these pictures to the appropriate places on the map, and then used a
green marker to trace these immigrants' routes. Students learned that, like many Chinese immigrants, Japanese immigrants traveled across the Pacific Ocean. You'll notice on the map below that I circled Hawaii in purple. (I used purple simply because purple wasn't used in any other way in this lesson.) This was a perfect opportunity to point out where Hawaii truly is in relation to the continental U.S. So many maps the kids see have Hawaii right underneath New Mexico and Arizona as a way for mapmakers to 'fit' all 50 states on one page. Kids need to know that Hawaii
isn't south of New Mexico and Arizona. It is nearly 2,000 miles west of the U.S. in the middle of the Pacific Ocean! I also explained that many people who live in Hawaii have ancestors from China and Japan.
Finally, I had students color the last box on their map key
blue (to stand for the fourth wave of immigrants who originally started coming over in 1965 to now. I handed out pictures of Vietnamese & Filipino immigrants and Caribbean immigrants (Cuba, Jamaica, and Dominican Republic) that I had copied on
blue paper. Students glued each of these pictures to the appropriate places on the map, and then used a
blue marker to trace their routes. Students learned that Vietnamese and Filipino immigrants traveled across the Pacific, while Caribbean immigrants didn't travel across an ocean, they traveled across the Gulf of Mexico!
*Please note that the groups of immigrants and the years of their arrivals discussed in this lesson are the ones highlighted in our Social Studies textbook. I was sure to explain to students that there were many immigrants who came to the U.S. from countries that weren't a part of this lesson and that some people from countries all over the world continue to emigrate to the U.S. to make it their home. In general, European immigrants travel/ed across the Atlantic, Asian immigrants travel/ed across the Pacific, and Caribbean immigrants travel/ed across the Gulf of Mexico!